A driving cycle commonly represents a set of vehicle speed points versus time. It is used to assess fuel consumption and pollutants emissions of a vehicle in a normalized way, so that different vehicles can be compared. The driving cycle is performed on a chassis dynamometer, where tailpipes emissions of the vehicle are collected and analyzed to assess the emissions rates.
In commercial vehicles area, the driving cycle is not performed on a vehicle dynamometer but on an engine dynamometer and is evaluated through a set of engine torque and speed points instead of vehicle speed points.
There are two kinds of driving cycles, the modal cycles as the European standard NEDC, or Japanese 10-15 Mode and the transient cycles as the FTP-75 or Artemis cycle. Main difference is that modal cycles are a compilation of straight acceleration and constant speed periods and are not representative of a real driver behavior, whereas transient cycles involve many speed variations, typical of on-road driving conditions.
European driving cycles
The NEDC

The NEDC is used as reference cycle for homologating vehicles until Euro6 norm in Europe and some other countries. It is made of an urban part called ECE, which is repeated four times, and an extra-urban part, the EUDC.
Here are the main characteristics of the cycle:
| Distance | 11023 m |
| Duration | 1180 s |
| Average speed | 33.6 km/h |
This cycle is criticized by experts as it doesn’t represent real life driving conditions. Indeed, accelerations are very soft; there are a lot of constant speed cruises and a lot of idle events. This make impossible to obtain certified values when driving with the vehicle in real conditions. For those reasons, a solution to replace the NEDC is being explored by European authorities. The new cycle called Worldwide Harmonized Light Vehicle Test Procedure (WLTP) will probably appear for the upcoming norm Euro7.
The Artemis driving cycle
This cycle is based on a statistical study done in Europe within the so called Artemis project. It is made of 3 different configurations, plus an additional variant: the urban cycle, the rural one, the motorway 130 km/h and the motorway 150 km/h.


Here are the main characteristics of the cycles:
| Urban | Rural | Motorway 150 | Motorway130 | |
|---|---|---|---|---|
| Distance | 4870 m | 17272 m | 29545 m | 28735 m |
| Duration | 993 s | 1082 s | 1068 s | 1068 s |
| Average speed | 17.6 km/h | 57.5 km/h | 99.6 km/h | 96.9 km/h |
Artemis cycles are not used for certification of pollutants or fuel consumption. However, car manufacturers use this kind of cycle to better understand real driving conditions and to assess real performances of their vehicles.
Note that it exists several other cycles more or less used by car manufacturers like the modem-Hyzem cycle that will not be described in this featured article.
American driving cycles
FTP-75 cycle
The FTP cycle (for Federal Test Procedure) has been created by US EPA (Environmental Protection Agency) to represent a commuting cycle with a part of urban driving including frequent stops and a part of highway driving.

Here are the main characteristics of the cycle:
| Distance | 11.04 miles (17.77 km) |
| Duration | 1874 s |
| Average speed | 21.2 mph (34.1 km/h) |
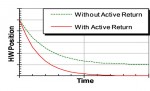
Highway Fuel Economy Test cycle
The Highway fuel economy test (HWFET) is used to assess fuel economy over highway driving cycle.

Here are the main characteristics of the cycle:
| Distance | 12.26 miles (16.45 km) |
| Duration | 765 s |
| Average speed | 48.3 mph (77.7 km/h) |
Other test cycles
In 2007, EPA decided to add 3 more cycles to the existing ones, in order to better reflect real world driving conditions.
The first one is the US06, which is a complement to what is missing in FTP-75 cycle. Indeed, this cycle has a higher top speed of 80 mph (130 km/h) and some higher acceleration which represents a much more aggressive driving behavior.
The SC03 is another added cycle which particularity is to be performed at 35°C ambient temperature. This is needed for taking into account the air-conditioning in fuel consumption and emissions calculations.
The last added cycle is the “cold cycle”. This is in fact a FTP-75 performed at -7°C ambient temperature.
Japanese driving cycles
The 10-15 mode cycle
The 10-15 mode Japanese cycle is being used for emissions and fuel consumption certification in Japan. It simulates both urban and motorway cycle, including idling, accelerations, cruising and decelerations. The measurements are performed while engine is hot, after a standard warming procedure.

Here are the main characteristics of the cycle:
| Distance | 4.16 km |
| Duration | 660 s |
| Average speed | 22.7 km/h |
This cycle has the same disadvantages as the NEDC, that’s why Japanese authorities and manufacturers decided to switch to a more realistic cycle starting from 2011, the JC08 cycle.
The JC08 cycle
The JC08 is a transient cycle which is much more demanding than 10-15 mode cycle. It is performed both with cold and warm start and it represents driving in congested condition, with strong accelerations and decelerations. 
Here are the main characteristics of the cycle:
| Distance | 8.17 km |
| Duration | 1204 s |
| Average speed | 24.4 km/h |
Global harmonized driving cycle
Like previous cycles, the Worldwide Harmonized Light vehicles Test Procedures (WLTP) is a test performed on chassis dynamometer. It allows to evaluate the pollutants and emissions, the fuel economy but also the electric range of light duty vehicles (passenger cars and vans). It is developed by European, Japanese and Indian experts in order to replace the NEDC cycle by 2013-2014.
The test procedure is divided into 3 cycles, depending on a power to mass ratio of the tested vehicle. This power to mass ratio (PMR) is defined as the rated power in W divided by the curb weight in kg. 3 classes are then defined as given in the following table:
| Power to mass ratio | Comments | |
|---|---|---|
| Class 3 | PMR ≥ 34 | If Vmax < 135 km/h, the Extra High speed part is replaced with Low speed part |
| Class 2 | 22< PMR < 34 | If Vmax < 90 km/h, the High speed part is replaced with Low speed part |
| Class 1 | PMR ≤ 22 | If Vmax < 70 km/h, the Medium speed part is replaced with Low speed part |
Class 3 cycle
Class 3 cycle is made of four speed zones: one representative of urban driving, one suburban driving, one extra-urban driving, and a highway zone.

Here are the main characteristics of the cycle:
| Distance | 23.262 km |
| Duration | 1800 s |
| Average speed | 46.5 km/h |
Class 2 cycle
Class 2 cycle is representing low, medium and relatively high vehicle speeds, covering Indian vehicles and European and Japanese low power vehicles.

Here are the main characteristics of the cycle:
| Distance | 14.664 km |
| Duration | 1477 s |
| Average speed | 35.7 km/h |
Class 1 cycle
This cycle is made of low and medium speed zones. It is typical of low power vehicles that can be found in India.
 Here are the main characteristics of the cycle:
| Distance | 8.091 km |
| Duration | 1022 s |
| Average speed | 28.5 km/h |
Heavy duty test cycles
As said earlier, heavy duty vehicle’s emissions and fuel consumption are assessed on engine test bench and not on vehicle test bench. It exists two world harmonized cycles used for homologation that are represented by a set of normalized engine load and engine speed (in % of maximum speed and load) versus time, the first one is stationary (WHSC for World Harmonized Stationary Cycle) and the second one is transitory (WHTC for World Harmonized Transient Cycle).
The WHTC is depicted below:

Note that the negative values are set arbitrarily to represent friction losses.
Source: UNECE
Romain Nicolas opinion:
Test cycles are today the only standard way to assess if the emissions legislation are fulfilled by vehicle manufacturers. Those tests have to be designed in a way that enhances the reduction of pollutants and CO2 emissions while it is not too restrictive in order to let the business be opened to several manufacturers and let competition go. Indeed this dilemma is tricky to handle by governments that are often tempted to favor local manufacturers when choosing the cycle that will be used for testing. Do you think we should design cycles that are not too restrictive in order to avoid reducing the number of models that can pass the test cycle satisfying regulations? Do you think that upcoming WLTP will reshuffle the automotive industry in Japan, Europe and India?


CAN ANYONE ASSIST ME WITH THE FOLLOWING QUESTION
WHAT WILL BE DIFFERENT IN FUEL COMSUMPTION AND EVENTUALLY INTO CO2 EMISSION WHEN SAME
VEHICLES IS TESTED UNDER JC08 AND NEDC CYCLES
THANKS FOR ANSWERING
Hello,
You have simulation tools like AMESim or Simulink that can easily answer this question. I tried to build a simple excel model and I used a vehicle with the following characteristics:
1150kg kerb weight, 0.7 SCx, 9kg/t crr, 5 speed manual gearbox 1.4l gasoline engine, 50.3kW/l max power, 94.1Nm max torque.
I got the following results but without a strong confidence:
NEDC: 6.6 l/100 km or 157.2 g CO2
JC08: 6.4 l/100 km or 153.5 g CO2
However, with a different engine or powertrain, the difference won’t be the same and there are no way to extrapolate.
Hope this helps.
Are excel versions of these charts available?
Hello,
Thank you for providing such a consice and comprehensive summary of the test cycles. I am particularly interested in the WLTC in which there are three categories according to kerb weight and power. I have some questions and would greatly appreciate any feedback.
1st the PMR categories according to class. I got a listing of of Kw/Kg ratios from Wiki and it seems that almost without expection all pass cars will fit into the class 3 cycle. Am I correct with this assumption? Do the class 2 & 1 possibly apply to different use i.e. motorcycles, lawn mowers etc? Or am I making the wrong assumption?
2nd, the WLTC is supposed to be introduced in 2013/14. I cannot find any confirmation of a firm date and whether or not it has been agreed to implement although there is concensus to adopt.
3rd, Are you aware to what extent the CO2 emissions will be impacted as a result of the WLTC? Today we are looking at circa 130 g/km CO2 with penalties and this reduces to around 95 by 2020 (Euro VII). I would assume that if the CO2 targets remain the same but the test cycle changes (makes more challenging according to a ‘proper’ drive cycle) then the challenge to meet future Euro levels will be much the greater.
I hope you can help and in anticipation look forward to your feedback.
Kind regards,
Hi,
Sorry for not having answered earlier but I was in vacation.
1st: Pretty correct assumption, some vehicles in India are however in class 2. Class 1 and 2 will apply to on-road vehicles of PMR < 34, so motorcycles mainly. 2nd: As automotive lobbying is quite important, the decision to implement WLTC will be postponed several times. An example of this lobby can be seen with postponing of China's 4 and 5 regulation or BSIV in India to a later date. 3rd: Simulations would answer easily this question. In terms of CO2, new driving cycle could be better (TBC) as the engine would operate more often close to its optimal operating point (higher loads, lower engine speed), but in terms of emissions, consequences would be important for manufacturers as they would need to reduce the pollutants on a broader range of engine operating points. I hope this helps you! Do not hesitate to contact me for more information. Best regards
Mr. Romain can u kindly send me the tables of all these graphs if possible? It is for my project work
Hello,
I’m trying to prepare a literature review on driving cycles. I have no idea why is very difficult to understand it.
Could you please direct me to something that I can start with, perhaps a book. Could you also please tell me how people work with the data they collect (are there standard programs that do calculations), are there examples of calculations?
I really appreciated every sort of help on this topic.
Thank you.
Hello,
Regarding literature, I have no idea. Maybe try to visit Delphi website which has a page dedicated to driving cycles explanation.
Regarding how the data are used, I can say that the driving cycles data (Vehicle speed vs time) are inputs to a simulation model or a vehicle roller bench, once the simulation or test is over, test engineer recover the recorded data and save them under a given data exchange format (it could be csv, xml, …).
That is generally the way we work with driving cycles.
Hope this helps.
Best regards
mr. romain, where can i get all tables for those charts above? i need them for my project.
thank you in advance
Hello,
In my country can’t measure emission on chassis dynamometer with ETC, only ESC. Can convert ETC to ESC? How to convert from ESC or ETC? Help me, please.
Thanks.
Hello,
I think it will be hard to extrapolate from steady to transient as the behavior of an engine is nonlinear. You may try to extrapolate using advanced simulation models like neural-networks or polynomial models, but there will always be uncertainties.
Mr. Romain , I need the tables of Artemis cycle and NEDC cycle for my research work ; thank you in advance
hello ,Mr. Romain, i need your jc08 cycle speed points data to do some vehicle tests, please send it to me by email :svvn@sina.com. many thanks.
Hi,
I sent you an email about that!
Hey Romain,
would you be so kind to send me the tables of the Artemis and NEDC cycles? I would need them for a comparison.
Thank you very much in advance.
Kind regards,
Manfred
Hey Romain,
would you be so kind to send me the speed/acceleration-points data and the tables of the Artemis cycles, too? I need them for vehicle testing.
Thank you very much in advance.
Kind regards,
Jonas
I will send you an email shortly.
Dear Romain,
could you please send me the data of the test cycles, too? I’m mostly interested in transient cycles (Artemis, FTP), as I want a load reference for the design of a gearbox.
Thank you very much and best regards
Felix
Dear Romain,
Is it possible to contact you for some help in regards to drive cycles. I have so many questions about drive cycles and I’m very dispirit, because I don’t know where to start.
I’d really appreciate any help you can provide.
Thank you,
Abdullah
Yes for sure! Feel free to contact me
Please how can I plot / generate power cycle of a vehicle dynamic model using NEDC driving cycle. I have the model and parameters like vehicle mass, aerodynamic coffienct, frontal area etc. Am just confused. I know excel can do it. I don’t have NEDC data’s… Am just confused. Please help.
The simpler is to use SW tools like AMESim. It can compute instantaneous and accumulated power along the driving cycle with provided parameters like the one you refered to. There is a free trial version available for students!
Dear Romain,
Can you please send me the tables corresponding to the different Artemis and JC08 cycle ?
It’s really nice to see all those cycles on only one page.
Thank you
Vincent
Hi Romain,
Would it be possible to get the Drive Cycle Data for; the NEDC cycle, the FTP-75 cycle, and the 10-15 cycle. With (if possible) a reference to where the data was attained originally, please. It is needed for a university project and so references are needed to be stated, and I am struggling to find the data with a viable reference, so your help would be greatly appreciated.
Thanks in advance,
Kindest regards,
Charisma
Hi!
I sent you an email about it!
Hi Romain,
is it possible that you can send me the excel sheet with the cycle data (time, speed, gear spreadsheet) ? This would be very helpful for my work
Thanks
Hi Romain,
Great article!
Can you please send me all the drive cycles in your article in excel format?
Thanks for your help.
Hi Romain,
Thank you very much for sending the drive cycles data so quickly..You are a very kind and caring person.
I wish you all the best and keep up the excellent work.
Best Regards
Richard
hi Romain,
Can I have numerical value for the Artemis rural cycle?
It will be extremely useful for my project work. Please send me the table of values.
Thank you sir.
Hello Romain,
Indeed a great article. Would it be possible for you to send me the Artemis-Highway Cycle, WLTC Class 3 and EPA 06 cycle data in excel sheet format. Need those for my Project work.
Thank you in advance.
Kind Regards,
Akshay
Thank you Romain for the useful information.
I also would be really grateful if you could send me the numerical data. It would be really helpful for my research.
Regards,
Maria.
can u explain cycles in short or comprehensive way
I see test cycles’ speed x time have been shared in Excel format. I need to perform a high-level simulation using both NEDC, WLTC and USA06 and would appreciate if somebody could share the Excel files by email.
Hi Romain. I need city cycles for bus. Braunschweig driving cycle for bus excel, csv or matlab. Also FTP-75/
My email is sell24info@mail.ru.
All this fancy stuff with tables and graphs is bull s**t. I have a 2000 corolla. Check engine light came on 19 miles after the codes were cleared. I simply drove it 15 miles instead, then brought it back for emissions. It passed. And NO – it did not come back OBD not ready. All these guys trying to seem like Joe great Mechanic on various sites are in love with themselves. These instructions at drive cycles are ludicrous and convoluted beyond belief. They are full of s**t.
Clear your codes then drive until the CEL comes back on. Note the miles. Then, drive three miles less than that next time and take your vehicle right in for emissions. And all this “you’ll fail because the OBD’s won’t be set” is nonsense. If you’ve got a 2000 model year or before then two monitors are allowed to not be ready and the test can still be taken. 2001 and later you can have one not ready.
People who claim that so many miles must be driven or that certain, specific conditions must be observed are, again, full of s**t. I put 15 miles on my car just on side streets – no freeway – and it passed. Try this. It may very well work for you.
Hi Romain,
This is a brilliant article. I have a project in the area of understanding the impact of different cycles on the power and energy requirements of various vehicles.
Would it be possible for you to share the graphs ideally in excel format or provide the speed / time values for all three artemis cycles.
Thanks for the support
Hi Romain,
Superb article!
Currently I am doing a master’s project on engine testing and I was in need of the WHTC and WLTC driving cycles in excel sheet. Can you please provide me with the required data? Email: prass.sutar@gmail.com
Hey Romain,
Very informative article.
Would be great if you share the source of the excel data, need it for a college project 🙂
Thanks!
Hi Romain,
Great article! Thank you for sharing with us ..
Can you please send me all the drive cycles in your article in excel format?
Thanks for your help.
Hi sir,
I am a student in IIT Hyderabad in India ,currently I am working on electric vehicles , I need excel data diffent driving cycles for my simulation,please provide me the data it may useful for my further studies.
Thank you,
vishnu
Hi Romain,
I am a Master Student from Technical University Chemnitz Germany. I do Master Automotive software Engineering. I do research internship on Regenerative braking for electric cars using neural networks. I need excel data for different driving cycle for my simulation, It would be great if you could support me with that. I need to complete my task before end of this month.
Thank you
Keerthirajhan Ravi
Hello Romain
Sir, your post is highly useful for my research. Thank u first of all since you discussed all the driving cycles in a single post. sir where can i get the speed-time data set points? If i get those details it will help me a lot in my research analysis
Thank You
Geetha
Hi Romain
Sir, whether the drive cycle helps in machine design of electric vehicle..? if yes, could you please tell me how..?
Hi Romain,
Would you be able to provide me the actual data points used in constructing the JC08 and WLTC Class 1 & 2 drive cycles? Also, would you have the data points for the JE05 drive cycle as well?
Thanks!
Hi Romain,
thank you for the great article!
Can you please send me the data points of the drive cycles in your article in excel format?
I need them for a project.
Thanks!
Hello Roman,
thank you very much for this clearly arranged information about different driving cycles!
I also would like to do some simulations, especially within the ARTEMIS cycle. Can you please send me the collected data as excel file or give me a hint or provide a link, where I can find it?
Thanks,
Benjamin
is it possible that you can send me the excel sheet with the cycle data,thank you very much
Hi,
thank you for your collection of driving cycles? I need some information about the MSE grza cycle and highway grza-vienna cycle .Do you have the information about this ?
Thanks
Rain,Guo
Hi,
Sorry I don’t have these ones. I guess it is Graz-Vienna ? Maybe you can use openstreetmap to generate the driving cycle ?
As a part of analysis I would to get the data of Time, vehicle speed and gear position of a normal car under normal running conditions. Could you please share the drive cycle data (Any one standard drive cycle data)
Could you please help me to get the data in excel sheet mail id- .renjith.shenoi@gmail.com
Many Thanks for help.
Renjith R
Automotive Engineering
Coimbatore
9539631056
Can I please have the data for ARTEMIS Motorway 130?
Hi Romain!
I’m a graduate student learning Electric vehicles at Wayne State University. As a part of my HW assignments, I’m modeling out various properties of the vehicle like Traction and Braking energy, DoD, Efficiency curves and some other. I would be happy if you could provide me with the excel data s for the cycles mentioned in the article and ECE -15, if possible.
Waiting for your kind reply and thanking in anticipation.
Hi Romain,
Thank you very much for a great article!
Would you please send me all the drive cycles in your article in excel format? I’m now do a PhD reasearch and I need the data of the many drive cycles!
I wish you all the best and keep up the excellent work.
Best Regards
Sinh
Everybody is asking about getting the raw data points. I don’t know about the rest, but here are links to the US government FTP-75 data files, available for free, in a nice, tab-delimited text file, suitable for Excel or whatever. (Note that for the urban driving cycle, each row of the file contains 10 data points for each second of run time (10 Hz)):
FTP-75 Urban Cycle: https://www.epa.gov/sites/production/files/2015-10/ftp10hztable.txt
FTP-75 Highway Cycle: https://www.epa.gov/sites/production/files/2015-10/hwycol.txt
Hi Romain, thank you for the great article. I was able to find the speed-time data for almost all standard cycles except for the JC 08. I need the data for a literature review on the various standardized test around the world and their progression. Can you please mail me the JC 08 if possible?
Thank you in advance!!
Regards,
Saurabh
Pingback: Your SEO optimized title
what do u ment by ECE
hi i need wltc Class 1 cycle’s data for avl cruise cycle run table editing thx for your answering.
Hi Romain,
a wonderful article, could you please send me the data points of these various cycles? I am doing my internship for my masters and i need them urgently.
Thank you very much
is there a AS102 drive cycle ?
Can any one help me finding the duty cycle of Electric vehicle transmission (I need to find duty cycle for 3 wheeler passenger & cargo auto.
with that how will you arrive at durability in hours.
Hi Romain
Can you refer me to the material that explains methodology of creating a standard test cycle? Also, how to design your own test cycle using Speed-time data of the vehicle?
Can you send me the excel data sheet for the vehicle NEDC or any other. I need it asap for my project to be presented tomorrow!
Hi Romain,
Great article!
Can you please send me all the drive cycles in your article in excel format?
i need it in my research please
Thanks for your help
Sorry, we I don’t have this in Excel format
Hi Romain
Great article!
Can I use the driving cycle you mentioned to do the vehicle fatigue assessment?
or is there a driving cycle is meant for vehicle speed-up fatigue test?
Best regards,
Glen