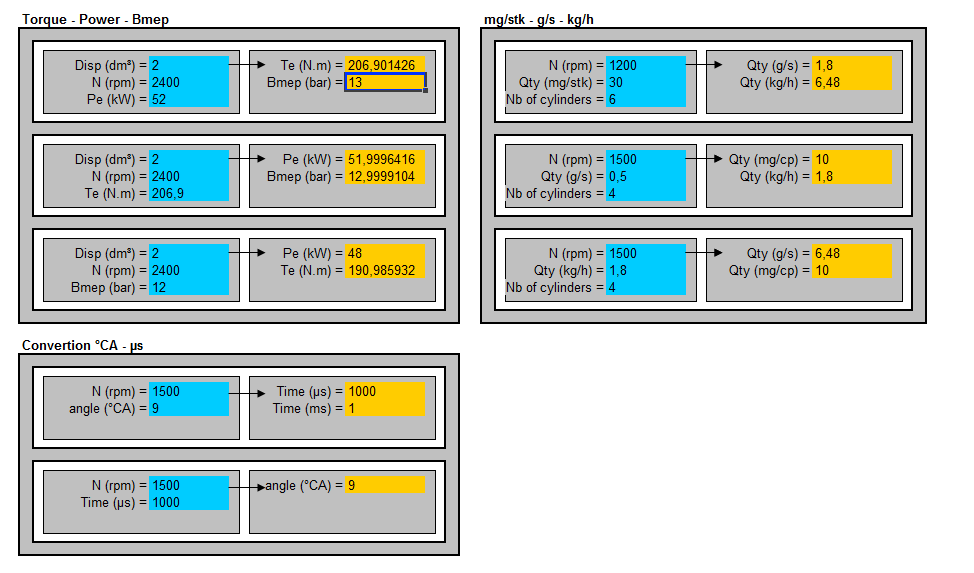
By means of a simple vehicle instrumentation, the system developed by CRMT (Research center for thermal machines) allows characterizing, in real time, parameters of the engine such as fuel injection timing (and the spark advance for controlled ignition engine), injection duration and air/fuel ratio in real driving conditions. A device for rapid acquisition of the signals (100 to 500 kHz / channel) performs continuous measurement of injectors control signals and primary or secondary current signals of the ignition coils.
Completed by measuring angular position of the crankshaft, the software calculates for each cycle the injection or ignition timing and the injection duration. The multi-cycle injection cases are also supported. These data are then transmitted at low frequency (one data set per engine cycle) to an acquisition module that can combine other measures. An additional module allows to fill-in engine maps depending on load and speed in real-time, allowing to adapt the driving conditions to cover the entire field of engine operation.
This engine strategies characterization tool may be used alone, or integrated in the CRMT thermodynamic analysis tool chain, which includes tools that allow:
- The complete thermodynamic analysis in real time (energy release law and calculation of cylinder temperature),
- The measurement of acyclisms,
- The knock determination,
- The graphical post-processing.
The diagram below shows the measurement process, for the case of an injection signal processing:[image_frame style=”framed_shadow” align=”center” alt=”Signal acquisition process” title=”Signal acquisition process” height=”510″ width=”500″]https://www.car-engineer.com/wp-content/uploads/2013/12/Measurement-process.png[/image_frame]
Example of high frequency measurements and identification of the injection parameters:[image_frame style=”framed_shadow” align=”center” alt=”Injection advance detection” title=”Injection advance detection interface” height=”500″ width=”610″]https://www.car-engineer.com/wp-content/uploads/2013/12/Injection-advance-detection.png[/image_frame]
The window at the top left corresponds to the base acquisition module, with its “save” features and specific display. The window at the bottom left allows live edition of characterization parameters. It also provides a view of current relevant variables (Advance, engine speed, injection time). The graphic window on the right shows the cycle to cycle display of actual significant quantities and of the current signal.
It is possible to save raw data for further analysis, in playback mode. Treatment of ignition for spark-ignition engines follows the same process and may be performed simultaneously with other treatments.
Example of low frequency measurements and real time maps filling:[image_frame style=”framed_shadow” align=”center” alt=”Measurements and maps auto-filling display” title=”Maps auto-filling display” height=”500″ width=”610″]https://www.car-engineer.com/wp-content/uploads/2013/12/Measurements-and-maps-auto-filling-display.png[/image_frame]
The window at the top left corresponds to the base acquisition module, with its “save” features and specific display here used for the parameters measured at low frequency (100 Hz to 1 kHz). The windows in the upper right corner show the maps being filled in driving conditions. They allow the display for each cell of:
- The mean value and standard deviation,
- The number of points used to calculate the mean value,
- The difference between the current mean value and a reference map.
The content and methods of maps filling are completely configurable. This module enables the backup of “raw” data. It will then allow to use a playback mode that simulates the initial procedure and helps to refine or correct algorithms afterwards.
Bottom left of the screen is a window that displays for each cycle the average values of each channel in physical units, and the delta between the measured value and the one identified in a reference map. The button “Enable backup measured values” can save for each cycle average values (one value per channel per cycle).[image_frame style=”framed_shadow” align=”center” alt=”Injection advance map generated with the tool” title=”Injection advance map generated with the tool”]https://www.car-engineer.com/wp-content/uploads/2013/12/Injection-advance-map-generated-with-the-tool.png[/image_frame]
Source: CRMT
[titled_box title=”Romain’s opinion:”]
This tool could be very helpful for doing some reverse engineering on competitors control algorithms. Do you think this kind of method is used by some OEMs? Do you think they have time to do such reverse engineering analysis or they sub-contract to another company?[/titled_box]